pyzbar is a QR code and Barcode decoder library available in python. It can detect multiple codes from one image and return the code type. OpenCV 4.1 also has QR code detector called QRCodeDetector but it can only detect one QR code from image and barcode is not supported, which is not as powerful as pyzbar.
Test environment: Python 3.6 with OpenCV4.1 and pyzbar 0.1.8
I built a traffic simulation network for PHD student to test her traffic light scheduler algorithm based on vehicle & pedestrian flow. The software I used is PTV Vissim (version 10), a world leading software for microscopic traffic simulation.
The software can link with external program using COM interface. Many kinds of data can be collected from the simulator during simulation, like vehicle id/speed/position, queue length, pedestrian id/position/speed, traffic lights state etc. External program can control objects in the network during simulation, in my case only traffic light will be controlled. The COM interface supports many types of programming language, like python, MATLAB, Java, C# etc. Below is the structure of our simulation system.
Check out the project website if you are interested:
But I’m too lazy to type the whole line, open a web browser, then key in the link to tensorboard. I made a batch file to launch tensorboard and tensorboard webpage, user just need to specify the model saved directory.
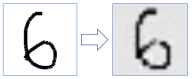
I’ve modified the MNIST model (a CNN model) in my previous blog post to make it able to classify color images. Check out my video below.
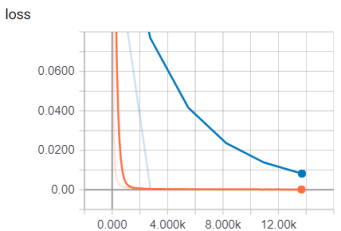
This time I used GPU to train the model, I found the training speed on GPU (Nvidia GTX 1060 3GB) is approximately 4x fasterthan on CPU (i7-7700HQ). The code that I used was the same, it took 4.966 seconds to run 100 steps on GPU, it took 20.530 seconds to run 100 steps on CPU.
As usual I made a python script to extract all images from this dataset so that I can visualize them.
There are 10 classes: airplane, automobile, bird, cat, deer, dog, frog, horse, ship, truck. Each class has 5000 images with size 32×32.
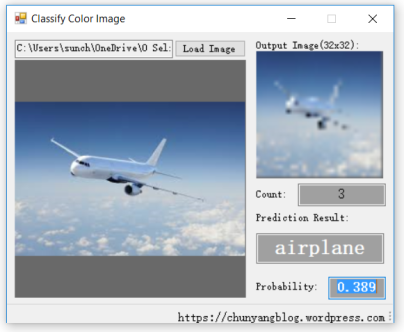
I made a GUI program (using C#) to let user select image from local drive, resize the image to 32×32 pixels so that it can be fed into the model. The GUI can display the prediction result together with the highest probability of the predicted class.
I searched a few images from Google for testing purpose and have demonstrated in the video, as you can see some predictions were wrong. There could be many reasons that can affect the prediction, for example the background of the object, the width/height ratio of the image, the size of the dataset, the model size(I used a 2 layer CNN) and so on. A better model may improve the performance, or a larger & higher resolution dataset.
I got data files that store hours of GPS position and speed data of Campus Buses operating in NTU, one problem I encountered is to identifying low speed regions. The first thing to do in my mind was to mark those positions (low speed) on the map, the heatmap does a great job on that, I found a sample code in Google Maps Javascript API website that teaches people how to use heatmap. It was quite simple to understand, I copied some codes and used them in my html file, a text box was designed to let user paste GPS positions in it, then generate and display low speed regions (heatmap) on Google Maps.
I made a python script to extract GPS positions with speed less than 5 km/h to a text file (see picture below).
Then copy all positions from this file to my html webpage and generate the heatmap (see picture below).
The highlighted regions are quite reasonable, most of the places are pedestrian crossings, intersections, bus stops, car parks. (See street view below)
I recently developed an Automata Debugger Software for my project team (CPISRG @ NTU). This software is an useful tool to debug the settings of automata located in different configuration files (see ConveyorBelt.cfg example below). Those configuration files can be loaded to SuSyNA to generate a Supervisor that gives optimized control sequence for known processes (saved in those configuration files based on station type). The requirements in configuration files are saved in transition (from state, event name, to state) format, it’s possible to use graph (see example graph below) to visualize their relations, I used Graphviz as the graph generator in my software. Continue reading →
This is a speed radar with customized firmware, the company that sold this didn’t provide PC based data logger software but the data can be extracted from its serial port. So I followed their manual and prepared a Data Logger Program by using C#.
They provided a tuning fork for indoor testing, knock the fork and put it near the radar will give continuous reading at about 45 km/h. This radar uses doppler effect to measure vehicle speed.
This project aims to schedule multiple e-puck robots for task scheduling by using one PC as the controller. I received 12 robots, their firmware has been customized to receive remote commands via Bluetooth and do line following tasks.
My first problem with these robots was that it’s impossible to connect 12 robots to a single PC via Bluetooth, according to wikipedia 1 Bluetooth master can connect maximum 7 slaves. I tried to install 2 (different) Bluetooth adapters to one computer but one driver always refuse to work, so I decided to use 2 computers to connect all robots, each computer connects to 6 robots, and I created 2 computer programs to link this 2 computer together via TCP/IP socket, this solved my problem. The system structure is below.